画了这么久的图,脑子里还是乱的,每次想实现个效果都能查到不同的实现方法,什么 plt.plot 啦,ax.plot 啦,看起来好像都能达到目的?特别是到了精调绘图细节,比如坐标轴范围、数字方向、标题等东西,更是头大,每次都要试来试去。决定好好理一下 matplotlib 到底怎么用🤦♀️🤦♀️🤦♀️
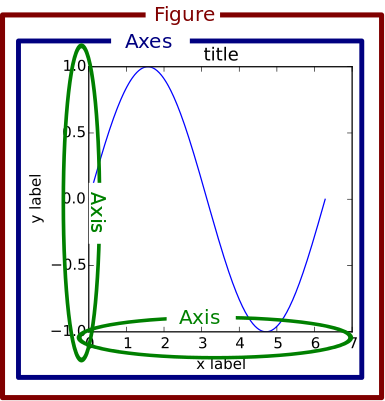
首先搞清楚了一直以来的疑惑(借用官方文档的一幅图说明):Figure,Axes,Axis 这三个是什么关系。
(图片来自:Usage)
- Figure: 红色的外框,其实可以把它理解为一个大画板,我们所有的内容都会画在这个“画板”上
- Axes: 蓝色的内框,有人这么解释:
Axis 指 x、y 坐标轴等(如果有三维那就还有 z 轴),代表的是 “坐标轴”。而 Axes 在英文里是 Axis 的复数形式,也就是说 axes 代表的其实是 figure 当中的一套坐标轴。之所以说一套而不是两个坐标轴,是因为如果你画三维的图,axes 就代表 3 根坐标轴了。所以,在一个 figure 当中,每添加一次 subplot ,其实就是添加了一套坐标轴,也就是添加了一个 axes,放在二维坐标里就是你添加了两根坐标轴,分别是 x 轴和 y 轴。所以当你只画一个图的时候,plt.xxx 与 ax.xxx 其实都是作用在相同的图上的。
说话的方式简单点… 要不就把 Axes 理解为子图(画布)吧,一张大画板 figure 上可以有一个或多个子图(画布)Axes,当只有一个 axes 时,plt.plot() 和 ax.plot() 自然就作用的是同一张图了!
官方文档也解释的很清楚:
The whole figure (marked as the outer red box). The figure keeps track of all the child Axes, a smattering of ‘special’ artists (titles, figure legends, etc), and the canvas. (Don’t worry too much about the canvas, it is crucial as it is the object that actually does the drawing to get you your plot, but as the user it is more-or-less invisible to you). A figure can have any number of Axes, but to be useful should have at least one.
- Axis: 绿色的横纵坐标轴,这个才是正儿八经的坐标轴!
类似于下面这样,定义 4 个 subplot,自然就有 4 个 Axes:
总结一下: figure 是作图时给你的一个大画板,而 axes 是在这个画板上的很多幅画布(子图),绘制的所有图都在画布(axes)上。比如上面的漫画布局,就可以用:
plt.figure()
plt.gcf().subplots(2,2)
- 1
- 2
来完成。其中 .gcf() 的作用是获取当前 figure,即 get current figure。另外对应的 .gca() 就是获取当前 axes,即 get current axes。
很多教程说的 plt.plot()、plt.scatter()、plt.bar(),其实本质上还是在 axes 上画图,可以将他们理解为:先在 figure(画板)上获取一个当前要操作的 axes(画布),如果没有 axes 就自动创建一个并将其设为当前的 axes,然后在当前这个 axes 上执行各种绘图功能。 plt.<xxx> 就相当于 plt.gca().<xxx>。
下来详细解释一下绘图时常用的操作:
1. plt.figure()
通常我们创建图形时,首先会用 fig = plt.figure() 创建一个 “画板”,并定义画板名称为 fig,此时画板是空白的,后面我们可以在画板上绘制一个或多个子图像。
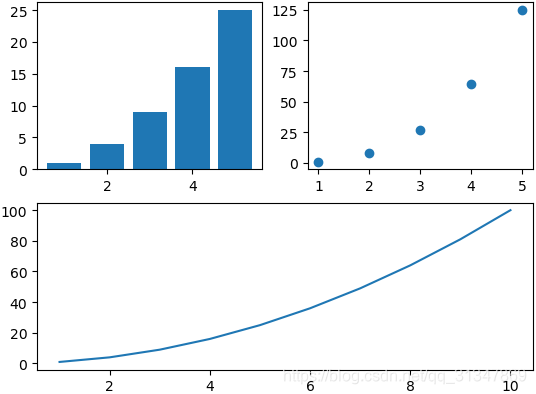
通过 ax = fig.add_subplot() 向画板中添加新的画布,并为画布指定名字为 “ax”,然后就可以单独给这个画布设置各种属性啦。
用栗子看一下:
# create data
A1 = np.arange(1, 6)  # x ∈ [1,5]
A2 = np.arange(1, 11) # x ∈ [1,10]
B = A1 ** 2
C = A1 ** 3
D = A2 ** 2

# create figure and axes
fig = plt.figure()
ax1 = fig.add_subplot(221)
ax2 = fig.add_subplot(222)
ax3 = fig.add_subplot(212)

# plot data
ax1.bar(A1, B)
ax2.scatter(A1, C)
ax3.plot(A2, D)

plt.show()
- 1
- 2
- 3
- 4
- 5
- 6
- 7
- 8
- 9
- 10
- 11
- 12
- 13
- 14
- 15
- 16
- 17
- 18
- 19
不过更好用的方法是 fig, axes = plt.subplots(),在创建画板的同时也将画布赋给了 axes,比上面的 add_subplot 要方便不少。
plt.figure 调用方法:
plt.figure(num=None, figsize=None, dpi=None,
		   facecolor=None, edgecolor=None, frameon=True,
		   FigureClass=<class 'matplotlib.figure.Figure'>,
		   clear=False, **kwargs)
- 1
- 2
- 3
- 4
参数说明:
num当给它一个数字时,就作为画板的编号,相当于 ID 号;当给它一个字符串时,就作为画板的名称figsize画板的宽、高,单位为英寸 (2.5cm)dpi指定在该画板上绘制的图像的分辨率,即每英寸多少个像素facecolor画板的背景颜色edgecolor画板的边框颜色frameon是否显示边框
应用实例:
import matplotlib.pyplot as plt
# 创建图形对象
fig = plt.figure(num='panel', figsize=(3,2),facecolor='gray')
plt.show()
- 1
- 2
- 3
- 4
这样就创建了一个为 panel,大小为 3*2 英寸,背景板颜色 灰色 的图形对象。
2. plt.subplot()
有了一个空白“画板”后,我们再用 subplot 在这个画板上分出多个子区域用来绘画。将画板整个区域分为 nrows 行,ncols 列,subplot 的 index 参数将指示当前绘制在第几个区域。区域编号的顺序从上之下,从左至右。
调用方法:
plt.subplot(nrows, ncols, index, **kwargs)
- 1
参考文档: matplotlib.pyplot.subplot
应用实例 1:
import matplotlib.pyplot as plt
fig = plt.figure(num='panel', figsize=(8,4),facecolor='gray')
# 划分三个小区域,绘制出第一个和第三个区域
plt.subplot(1,3,1)  # 划分1行3列,第1个子区域
plt.subplot(1,3,3)  # 划分1行3列,第3个子区域
plt.show()
- 1
- 2
- 3
- 4
- 5
- 6
有时我们需要的子图大小是不一样的,此时的解决办法是划分多次,每一次划分将目标子图安置在合适的位置就可以啦。
应用实例 2:
import matplotlib.pyplot as plt
fig = plt.figure(num='panel', figsize=(8,4),facecolor='gray')
# 绘制两个不同大小的区域
plt.subplot(1,3,1) # 划分1行3列,第1个子区域
plt.subplot(1,2,2) # 划分1行2列,第2个子区域
plt.show()
- 1
- 2
- 3
- 4
- 5
- 6
其实把每一次 subplot 动作看作是独立的就行了,第一次将整个画板划分为1行3列完全不影响第二次划分为1行2列,它们仅影响当前划分后子图的大小。
3. plt.subplots()
最常用的就是 subplots,便于绘图时精调细节信息。如果用 subplots 创建了多个子图,那么 axes 就是一个 list,用索引列表元素的方法就能获取到每一个 axes。
用例子看一下:
import matplotlib.pyplot as plt
import numpy as np

# create data
A = np.arange(1,5)
B = A**2
C = A**3

# create figure and axes
fig, axes = plt.subplots(1, 2, figsize=(6,3))

# plot data
axes[0].plot(A,B)
axes[1].scatter(A,C)
- 1
- 2
- 3
- 4
- 5
- 6
- 7
- 8
- 9
- 10
- 11
- 12
- 13
- 14
axes 能够直接通过索引获取,所以也能够写入循环中:
import matplotlib.pyplot as plt
import numpy as np

# data
A = np.arange(1, 5)
B = A ** 2
C = A ** 3

# create figure and axes
fig, axes = plt.subplots(1, 2, figsize=(6, 3))
colors = ['r', 'g']

# plot data
for ax, c in zip(axes.flatten(), colors):
	ax.plot(A, B, c=c)
plt.show()
- 1
- 2
- 3
- 4
- 5
- 6
- 7
- 8
- 9
- 10
- 11
- 12
- 13
- 14
- 15
- 16
设置每一个 axes 的坐标轴信息:
# 设定标题
ax.set_title('Title',fontsize=18)
ax.set_xlabel('xlabel', fontsize=18,fontfamily = 'sans-serif',fontstyle='italic')
ax.set_ylabel('ylabel', fontsize='x-large',fontstyle='oblique')
ax.legend()

# 属性设定
ax.set_aspect('equal')
ax.minorticks_on()
ax.set_xlim(0,16)
ax.grid(which='minor', axis='both')

# 坐标轴细节
ax.xaxis.set_tick_params(rotation=45,labelsize=18,colors='w')
start, end = ax.get_xlim()
ax.xaxis.set_ticks(np.arange(start, end,1))
ax.yaxis.tick_right()

# 关闭坐标轴
plt.axis('off')  # 需要位于plt.imshow之后,plt.show之前
- 1
- 2
- 3
- 4
- 5
- 6
- 7
- 8
- 9
- 10
- 11
- 12
- 13
- 14
- 15
- 16
- 17
- 18
- 19
- 20
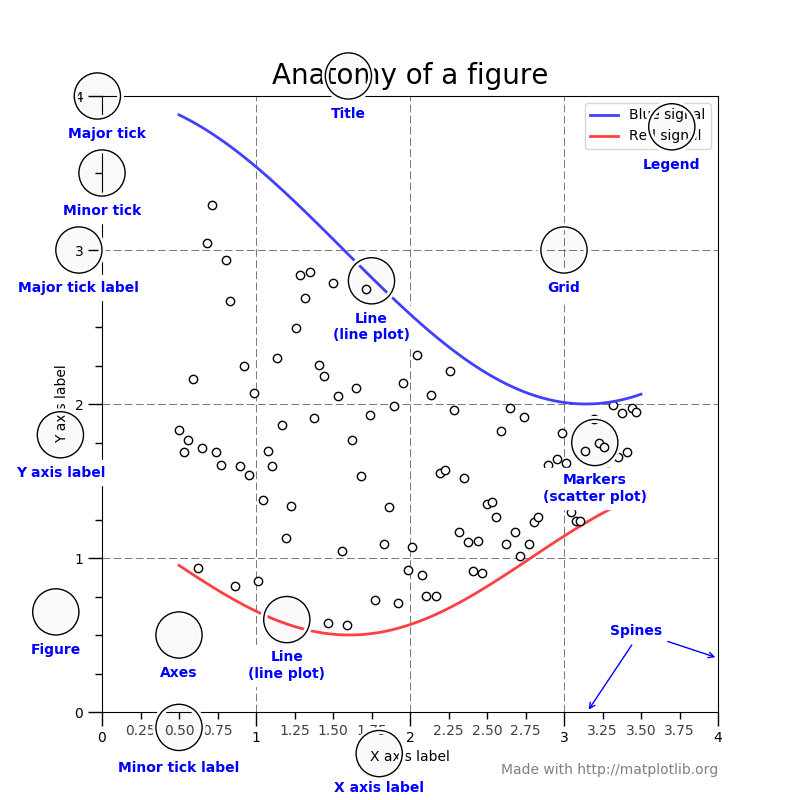
用 subplots 创建一个画板,同时也创建了一个绘图子区域 axes。画板赋值给了 fig,绘画子区域赋值给了 ax。这样一来,所有 fig.*** 都是对整个画板进行操作,所有 ax.*** 都是对这个 Aexs 子区域进行操作。
(图片来自:Usage Guide)
参考资料:
matplotlib 官方参考文档
https://zhuanlan.zhihu.com/p/93423829
Python matplotlib高级绘图详解


